How Tide Stations Work
Where Your Tide Charts Actually Come From
You pull up a tide chart, see that high tide is at 2:47 PM, plan your trip around it, and show up to your spot with absolutely no water on the flat. What the heck?
There's a good chance the tide station you were looking at is 30 miles from where you're actually fishing. Or it's a reference station predicting conditions for the open coast while you're tucked into a narrow creek that behaves completely differently. Understanding how tide stations work — and which one to trust for your spot — is one of those things that separates anglers who consistently time the tides from those who just get lucky sometimes.
Let's pull back the curtain on where all this tidal data actually comes from.
What Is a Tide Station?
A tide station is a fixed location where water level measurements are collected, either by physical sensors in the water or through mathematical predictions based on nearby measurements. NOAA (the National Oceanic and Atmospheric Administration) operates the primary network of tide stations in the United States, and their data feeds virtually every tide chart, fishing app, and marine forecast you've ever used.
There are over 3,000 tide stations in the NOAA network covering the U.S. coastline, territories, and beyond. Some of them have been collecting data continuously for over a century. That's a lot of tides.
But here's the thing most people don't realize: not all tide stations are the same. There are two very different types, and knowing the difference matters for your fishing.
Reference Stations vs. Secondary Stations
This is the part most anglers never think about, and it's the reason your tide chart might be lying to you.
Reference Stations: The Real Deal
Reference stations are the heavy hitters. These are physical locations with actual instruments in the water — pressure sensors, acoustic sensors, or radar — continuously measuring the real water level in real time. NOAA maintains these stations, services the equipment, and uses the long-term data to build the tidal prediction models that everything else is based on.
Reference stations are typically located at major ports, harbors, and coastal areas where shipping traffic, commerce, or scientific research demands highly accurate tidal data. Think places like Key West, Charleston Harbor, San Francisco Bay, or the Battery in New York.
The data from reference stations is gold. It's actual measurements, verified against decades of historical records, and continuously quality-checked. When a tide chart shows predictions for a reference station, those predictions are about as accurate as tidal science can get — usually within a few inches and a few minutes under normal conditions.
The catch? There aren't that many of them. You might be fishing miles from the nearest reference station, which means the tidal conditions at your spot could be meaningfully different from what the reference station is showing.
What's Inside a Modern Tide Station
If you've ever walked past one of those small, unassuming enclosures on a dock or pier and wondered what's inside, the answer is more impressive than you'd think. Modern NOAA tide stations are packed with sensors that go well beyond just measuring water level.
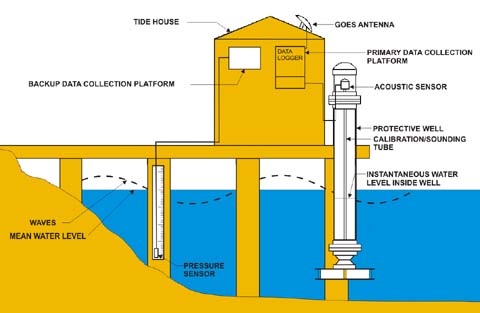
The primary water level sensor is an acoustic sensor — it sends an audio signal down a narrow sounding tube and measures how long the reflected signal takes to bounce back from the water's surface. The travel time tells the system exactly where the water level sits. There's also a pressure sensor as a backup, sitting in the water and measuring the weight of the water column above it.
But these stations don't just measure water level. They're also recording wind speed and direction, air and water temperature, barometric pressure, and water current speed and direction — all the same data points that matter for fishing. Readings happen every six minutes, and the data gets transmitted hourly via satellite (NOAA's GOES system) back to headquarters.
During storms, these stations can switch to a higher-frequency transmission mode, sending data every six minutes to help track storm surge in near real-time. That's the same data that emergency managers use during hurricanes — and it's the same network feeding the tide chart on your phone.
The Fishing Connection: All that extra data — wind, water temperature, barometric pressure — is collected at the same stations generating your tide predictions. That's why good marine forecast tools can show you pressure trends and water temps alongside tides. It's all coming from the same hardware on the same dock.
Secondary Stations: Educated Estimates
Secondary stations fill in the gaps. These are locations where NOAA has calculated tide predictions based on their relationship to a nearby reference station. The agency collects short-term observations at the secondary location, compares them to the reference station data, and derives time and height corrections.
For example, if a secondary station shows that high tide consistently arrives 23 minutes later and 0.4 feet lower than the reference station it's linked to, those offsets get applied to the reference station's predictions to generate the secondary station's tide chart.
This works pretty well in many situations. But it's an estimate, not a direct measurement. The further a secondary station is from its reference station, or the more complex the local geography between them, the more room there is for error.
Why This Matters for Fishing: If your favorite fishing creek is between a reference station at the harbor mouth and a secondary station two miles up the ICW, the tides at your spot might split the difference — or behave differently from both. Narrow channels, shallow bars, and tight bends all affect how fast tidal current actually reaches your location. The chart gives you a starting point, but local experience fills in the rest.
How Tide Predictions Are Made
This is where it gets interesting. Tide predictions aren't weather forecasts. They're not models running on supercomputers trying to guess what the atmosphere will do next week. Tidal predictions are based on astronomy — the predictable, repeating positions of the moon and sun relative to Earth. And because those positions are mathematically precise, tide predictions can be calculated years or even decades in advance.
The basic process works like this:
- Collect data. NOAA gathers years of continuous water level observations at a reference station.
- Identify the cycles. The data is broken down into harmonic constituents — the individual gravitational effects of the moon, sun, and other astronomical factors that each contribute to the overall tide. There are dozens of these constituents, each with its own period and amplitude.
- Build the model. The constituents are combined mathematically to predict future water levels. The more years of data available, the more constituents can be accurately resolved, and the better the predictions.
- Apply corrections. For secondary stations, time and height offsets are applied to the reference station predictions.
The result is the tide chart you check before every fishing trip. For most coastal locations under normal conditions, these predictions are remarkably accurate.
When Predictions Miss
Tide predictions assume normal atmospheric conditions. They don't account for:
- Wind. A strong onshore wind can push water levels well above predicted heights. Offshore winds can pull them lower. And since wind over water is almost always stronger than forecasted, the effect can be bigger than you'd expect. If you've ever shown up for a "low tide" wade-fishing session and found an extra foot of water on the flat because the wind has been blowing from the south for three days, you know exactly what this means.
- Barometric pressure. Low pressure systems raise actual water levels; high pressure lowers them. A passing storm can shift things by several inches. This is one reason barometric pressure is worth tracking alongside tides.
- Rainfall and runoff. Heavy rains upstream can raise water levels in bays and estuaries beyond what the tide chart predicts. After a major storm, creek and river mouths may stay high regardless of what the tide says.
- Storm surge. In extreme weather, storm surge can overwhelm tidal predictions entirely. The chart becomes irrelevant when a hurricane is pushing a wall of water inland.
The 80% Rule: Think of tide predictions as about 80% of the story. The astronomical tides will do what the chart says. The other 20% is weather — wind, pressure, and runoff modifying the predicted levels and timing. On calm, stable-weather days, the chart is nearly perfect. On windy or stormy days, treat it as a general guide.
How to Pick the Right Tide Station
This is the practical question: which station should you actually be looking at when you're planning a fishing trip?
Get as Close as Possible
The single most important factor is proximity. A tide station 5 miles from your fishing spot will be more accurate than one 30 miles away, even if the far one is a reference station. The closer the station, the more likely the tidal timing and height match what you'll actually see.
Most fishing and marine forecast tools let you select from nearby stations. My Marine Forecast shows all NOAA tide stations within 50 miles of your selected location, sorted by distance, so you can pick the one closest to where you actually fish.
Consider the Geography
Distance isn't everything. A station on the open coast might be 10 miles from your spot in a back bay, but the tidal behavior could be drastically different. Water has to travel through inlets, around barrier islands, and up winding channels to reach your location. Each of those features slows the tide down and can reduce the tidal range.
As a general rule:
- Open coast stations are great for fishing jetties, piers, beaches, and nearshore structure.
- Bay and harbor stations are better for fishing inside protected waters.
- ICW and creek stations are best for inshore fishing, but there are fewer of them. If one exists near your spot, use it.
Learn Your Offset
Here's where local knowledge comes in. Fish your favorite spot enough times with a tide chart open, and you'll start to notice the pattern. Maybe the tide change at your creek runs about 40 minutes behind the nearest station. Maybe the tidal range at your flat is only about 60% of what the chart shows because the inlet restricts water flow.
Once you know your offset, you can mentally adjust any tide chart to fit your spot. This is the kind of information no app can give you — it comes from time on the water. Write it down.
Pro Move: Fish your spot on a stable-weather day (no wind, steady barometric pressure) and time the actual tide changes against the chart. Do this a few times and you'll have your offset dialed in. This removes weather variables and gives you the true astronomical difference between the station and your location.
What All Those Numbers Mean
When you look at a tide chart, here's what you're seeing:
Tide Height
Tide height is measured in feet above a reference point called MLLW — Mean Lower Low Water. This is basically the average of the lower low tide over a 19-year cycle (called the National Tidal Datum Epoch). It's the "zero point" for tidal measurements.
So when the chart says high tide is 4.2 feet, that means 4.2 feet above that average low-water baseline. A predicted low tide of 0.3 feet means the water is only 0.3 feet above the baseline — near the bottom of the range.
Negative tides (like -0.5 feet) happen during spring tides, especially around new and full moons. These are lower than the average low water mark and can expose areas that are normally submerged. Great for finding new structure. Bad for running your boat through shallow channels.
High and Low Predictions
Standard tide charts show the times and heights of high and low tides — typically two highs and two lows per day (semidiurnal tides) for most of the Atlantic and Pacific coasts. Some areas, particularly along the Gulf Coast, experience diurnal tides with just one high and one low per day.
The timing between these highs and lows is where moving water and feeding activity come from. The transition periods — especially the two hours before and after each change — are what you're really planning around as an angler.
Tidal Range
The difference between high and low tide height is the tidal range, and it varies significantly depending on location and moon phase. A range of 2 feet means gentle current. A range of 8 feet means water is really moving. Spring tides (new and full moons) produce the biggest ranges; neap tides (quarter moons) produce the smallest.
Bigger range generally means stronger current, more bait movement, and more aggressive feeding — but also trickier boat handling and faster-changing conditions. Know your range and plan accordingly.
Why Your Tide Chart Might Show Different Times Than Your Buddy's
This one comes up a lot. You're planning a trip with a friend, you both check the tides, and somehow you've got different times for high tide. Before you question your friendship, here's what's probably happening:
- Different stations. If you're using different apps or tools, they might be defaulting to different nearby stations. A station at the inlet and one 15 miles up the bay can show high tide an hour apart.
- Different datums. Some tools show predicted tides based on MLLW, others might use a different reference. The times should be close, but the heights might look different.
- Rounding and display. Some apps round to the nearest 5 or 15 minutes. Others show exact predicted times. Minor differences, but enough to confuse things.
The fix is simple: agree on the same station. Pick the one closest to where you'll actually be fishing, and you'll both be working from the same playbook.
Key Takeaways
- Not all tide stations are equal. Reference stations have real instruments; secondary stations use calculated offsets. Both are useful, but reference stations are more precise.
- Proximity matters most. Use the closest station to your actual fishing spot. A nearby secondary station beats a distant reference station.
- Geography affects timing. Tidal current takes time to travel through inlets, channels, and bays. Your spot might lag behind the station by minutes or even an hour.
- Predictions are astronomical, not meteorological. Wind, pressure, and rainfall can shift actual conditions from what the chart shows. Factor in weather, especially on gusty days.
- Learn your offset. Fish your spots enough times with a chart open, and you'll know exactly how your water behaves relative to the nearest station. That's knowledge you can't Google.
- Tidal range tells the story. Big range equals strong current and active feeding. Small range means calmer conditions and different tactics.
The tide chart is the starting point for every fishing trip. Now that you know where the data actually comes from — and where it might fall short — you can use it with a lot more confidence. And when the tides don't match the chart, you'll know why.
Related Articles
- How the Moon Affects Tides and Fishing
- What Is Tide Coefficient?
- Major and Minor Feeding Times for Fishing
- How Barometric Pressure Affects Fishing
Check Your Tide Station
Check My Marine Forecast to see tide predictions from the NOAA station closest to your fishing spot — along with feeding times, moon phase, barometric pressure, and wind — so you can plan your trip around the conditions that actually matter.